

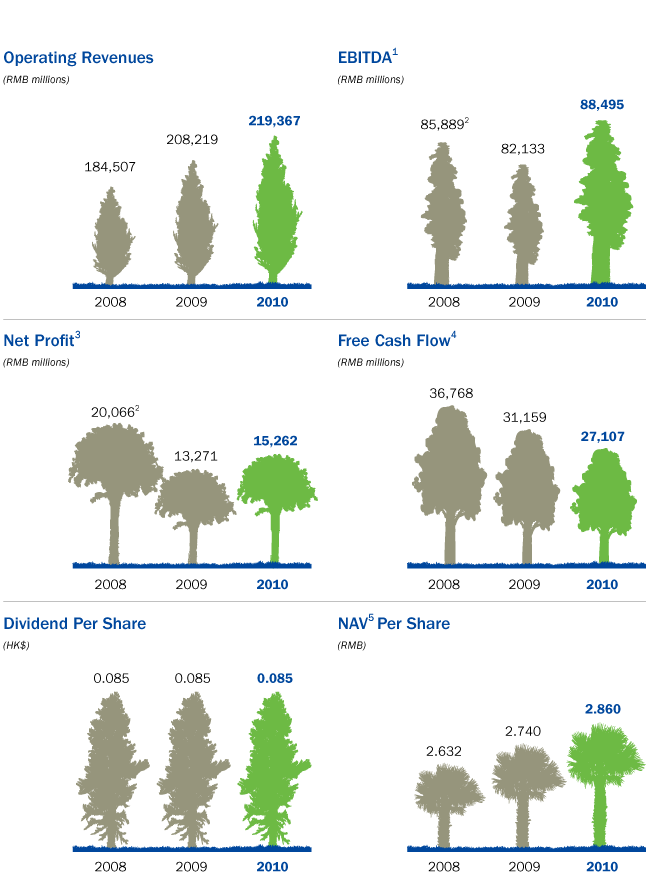
The charts below are based on financial figures excluding amortisation of the upfront connection fees
Excluding amortisation of the upfront connection fees
 | |||
|
2008 |
2009 |
2010 |
|
|
Operating revenues (RMB millions) |
184,507 |
208,219 |
219,367 |
|
EBITDA1(RMB millions) |
85,8892 |
82,133 |
88,495 |
|
EBITDA margin |
46.6%2 |
39.4% |
40.3% |
|
Net profit3 (RMB millions) |
20,0662 |
13,271 |
15,262 |
|
Capital expenditure (RMB millions) |
48,410 |
38,042 |
43,037 |
|
Free cash flow4 (RMB millions) |
36,768 |
31,159 |
27,107 |
|
Total debt/Equity5 |
57.9% |
47.8% |
31.8% |
|
Earnings per share (RMB) |
0.2482 |
0.164 |
0.189 |
|
Dividend per share (HK$) |
0.085 |
0.085 |
0.085 |
|
Net asset value5 per share (RMB) |
2.632 |
2.740 |
2.860 |
Including amortisation of the upfront connection fees
|
2008 |
2009 |
2010 |
|
|
Operating revenues (RMB millions) |
186,529 |
209,370 |
219,864 |
|
Net profit3 (RMB millions) |
884 |
14,422 |
15,759 |
1 For convenience of the investors’ analysis, EBITDA is calculated before CDMA network capacity lease fee.
2 Excluding the impact of impairment loss of the PAS assets and natural disasters in 2008.
3 Net profit represents profit attributable to equity holders of the Company.
4 Free cash flow is calculated from EBITDA minus CDMA network capacity lease fee, capital expenditure and income tax.
5 Equity and net asset value represent equity attributable to equity holders of the Company.
For further information, please browse our website at www.chinatelecom-h.com
The charts below are based on financial figures excluding amortisation of the upfront connection fees